IntroductionTo improve the service and after sales support, in the N720 software 89 or higher we have implemented the new feature: Visualisation of sync chains. This new feature will provide you with a graphical overview of the Base station synchronisation chains and the RSSI value from the slave to the Master Base station. Measurements shown in this diagram are for orientation only. To determine exact values use the professional Gigaset N720 SPK (Site Planning Kit). |
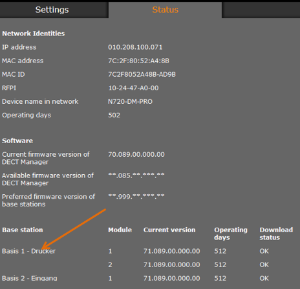
Status page:On the Status page, you can click on the Base station to open the graphical overview. 
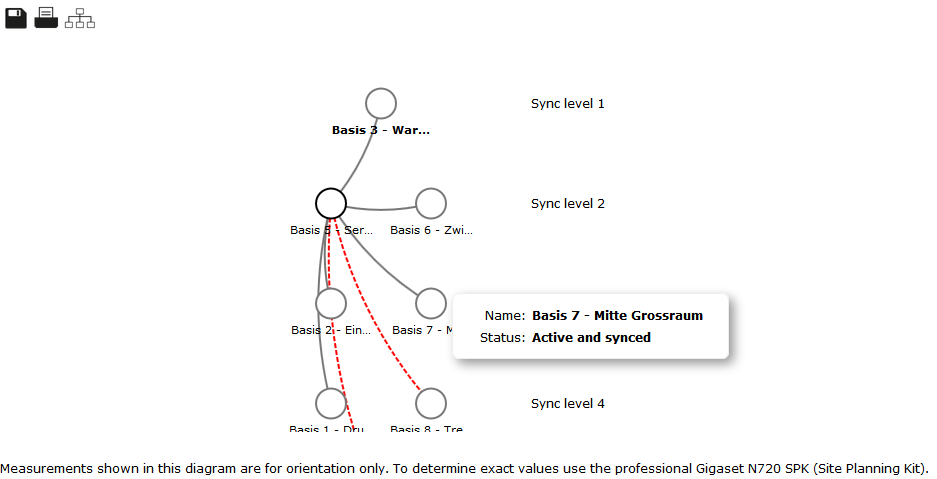
The screen below will be shown and will provide you with the overview of the Base station and how this base can see the surrounding base stations. 
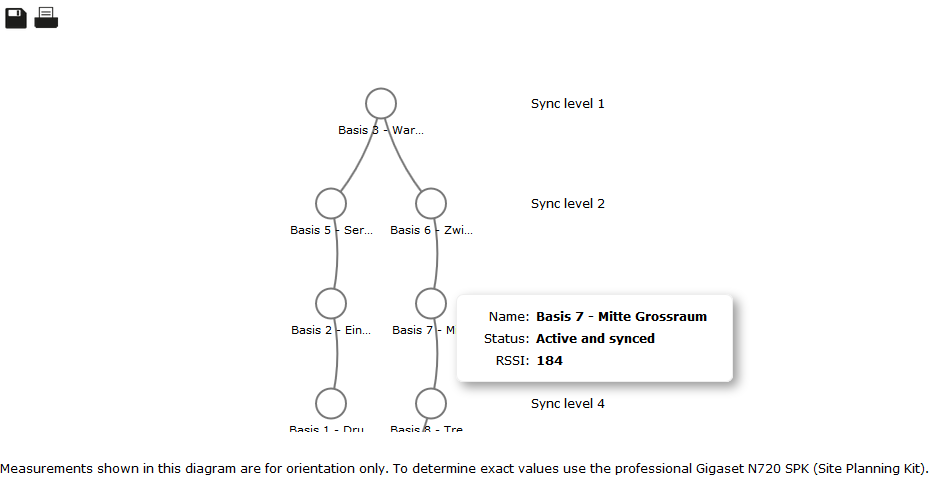
When you click on the icon: then you will get the overview about the Synchronisation levels and when your mouse moves over a base station, additional information like the RSSI value is shown. then you will get the overview about the Synchronisation levels and when your mouse moves over a base station, additional information like the RSSI value is shown. 
The values are the current signal values and can/will change the next time you will create another overview. LegendConnections between base stations | RSSI range (1-255) | Signal quality | Filled grey line | 109 < range <= 255 | Excellent-Good | Red dotted line | 0 < range <= 109 | Poor | No line | See below | no data |
Remarks: - Line is not drawn when there is no data available for given connection
- Values determining range limit are not constant. The measurements shows fluctuating data.
- Graphics and values can be treated only as a warning that signal strength is below the system requirements and advice to perform some measurements with equipement dedicated for such purposes: e.g. Gigaset N720 SPK (Site Planning Kit).
| 

 then you will get the overview about the Synchronisation levels and when your mouse moves over a base station, additional information like the RSSI value is shown.